Dirty Duckling — the smoke test
This page does one job: prove your setup works. Every step has a PASS criterion; if all of them hold, your machine can run everything else on this site. It is triage-pg’s homage to DSSG triage’s Dirty Duckling — the fast way to test the waters before the full DirtyDuck case study.
You need: Docker, uv, and a checkout of ccd-ia/triage-pg. Everything runs from the repo root. About ten minutes total; the food-inspections database and the experiment run entirely on your machine.
Step 1 — the CLI exists
Section titled “Step 1 — the CLI exists”uv sync --extra dev --extra dashboarduv run triage --versionPASS: the version prints:
triage-pg 1.2.1If it fails: uv: command not found → install uv
(curl -LsSf https://astral.sh/uv/install.sh | sh). A Python resolution error
→ you need Python 3.12+ (uv python install 3.12).
Step 2 — the tutorial database is up
Section titled “Step 2 — the tutorial database is up”just tutorial-up # docker compose: builds + starts the food DBpg_isready -h 127.0.0.1 -p 5440PASS:
127.0.0.1:5440 - accepting connectionsIf it fails: Docker isn’t running (start Docker Desktop / dockerd), or
port 5440 is taken — set another port and re-run:
export DIRTYDUCK_PG_PORT=5444 && just tutorial-up (then use that port and
adjust dirtyduck-database.yaml accordingly). First build takes a few minutes;
just tutorial-logs shows progress.
Now tell the CLI how to reach it. Create the connection file (it’s git-ignored — local config holding the tutorial’s throwaway credentials):
cat > dirtyduck-database.yaml <<'YAML'host: 127.0.0.1user: food_userpass: some_passwordport: 5440db: foodYAMLStep 3 — the results schema exists
Section titled “Step 3 — the results schema exists”uv run triage --dbfile dirtyduck-database.yaml db upgradePASS: migrations stream by and it ends with:
Database upgraded.The food database ships with the source tables (raw, clean,
ontology.*); this creates the triage schema — experiments, runs, the
artifact DAG, append-only predictions, the in-PG evaluation functions — via
alembic, idempotently (re-running is a no-op).
Step 4 — the config validates
Section titled “Step 4 — the config validates”uv run triage --dbfile dirtyduck-database.yaml analyze-config example/dirtyduck/experiment.yamlPASS: a panel report with no errors — the temporal splits, a model grid of 8, the 32 models that grid will actually produce, and the cohort/label SQL summaries:
Feature columns 147 Temporal splits 4 Matrices to build 8 (4 train + 4 test) Model grid size 8 Model groups 8 Feature-group runs 1 Models to be trained 32╭──────────── Label Configuration ────────────╮│ Label name: failed_inspections ││ SQL: select entity_id, bool_or(result = ││ 'fail')::integer as outcome from ││ ontology.events where {as_of_date}… │╰─────────────────────────────────────────────╯Read Models to be trained as the cost of Step 5: grid size × splits ×
feature-group runs (8 × 4 × 1 here). The 8 matrices are built once and every
model reads them; you’ll see those exact 32 models on the leaderboard in Step 6.
Add --estimate and it also counts the cohort and label rows those 32 models
will be fitted on.
This is the same validator the write-webapp runs before accepting a
submission — errors come back path-addressed (temporal_config.…,
label_config.query) so you know exactly what to fix.
Step 5 — the pipeline runs end to end
Section titled “Step 5 — the pipeline runs end to end”uv run triage --dbfile dirtyduck-database.yaml run \ example/dirtyduck/experiment.yaml --project-path /tmp/dirtyduck-runOne command walks the whole pipeline — a few minutes on a laptop:

It builds the cohort and labels, generates point-in-time-correct features (featurizer’s as-of joins), assembles train/test matrices per temporal split, trains a small grid, appends predictions, and evaluates in-database.
PASS: the terminal ends with exactly this shape:
Experiment b9e38fd8f366… completed: 1 run(s), 32 model(s), 430176 prediction(s),192 evaluation(s). run <your-run-id>… (all-features): 32 model(s), 430176 prediction(s), 192evaluation(s).storage: /tmp/dirtyduck-runTwo things to check beyond the counts:
- Your experiment hash must be
b9e38fd8f366…too. The hash is computed from the problem (cohort + label + temporal config, nothing else) — if yours differs, you edited the config; that’s a different experiment, which is exactly the reproducibility contract working. - The run id after it is yours alone — every attempt gets a fresh one.
If it fails mid-run, the error names the failing stage (cohort, labels, features, matrix, model). Re-running is safe: completed artifacts are content-addressed and cache-hit, so a re-run resumes instead of redoing.
Step 6 — the results are queryable
Section titled “Step 6 — the results are queryable”uv run triage --dbfile dirtyduck-database.yaml leaderboard b9e38fd8PASS: a ranked table — 8 model groups × 4 test splits (as-of dates
2015-07 → 2017-01), auc_roc by default, logistic regressions and tree
ensembles trading places at the top, the baselines below them:
Group Model Algorithm Metric As-of Value 5 29 ScaledLogisticRegre… auc_roc 2017-01-01 0.5751 4 28 ScaledLogisticRegre… auc_roc 2017-01-01 0.5748 3 27 RandomForestClassif… auc_roc 2017-01-01 0.5612 7 31 BaselineRankMultiFe… auc_roc 2017-01-01 0.5521 …The floor is on the same board: the DummyClassifier baseline sits at
auc_roc 0.500 while the top model reaches 0.575 (2017-01 split) — every real
model clears the floor, so the features are earning their keep. That gap is the
whole point of shipping baselines in the grid.
Want a bigger gap? This config features the inspection verdict
(result/risk) and never its content — what inspectors actually found.
experiment-violations.yaml
promotes the violations record into typed counts (n_critical, …) and keyword
flags over the inspector’s comment (“did a prior inspection mention rodents”),
then uses a feature_groups leave-one-out fan-out to make the comparison
legible: with violation-content features the mean test AUC climbs to ≈ 0.62,
and removing them costs more than removing any other feature group — the
verdict features were the weak ones. Same experiment hash, new runs: the
leaderboard compares them directly.
Hash prefixes work everywhere the CLI takes a hash, git-style.
PASS — now the five-minute tour
Section titled “PASS — now the five-minute tour”Your installation works. Point the dashboard at the same database and look at what you just built:
just serve 8001 # then open http://127.0.0.1:8001(The dashboard reads the same PG*/dbfile resolution as the CLI; the quickest
route is cp dirtyduck-database.yaml database.yaml before serving.)
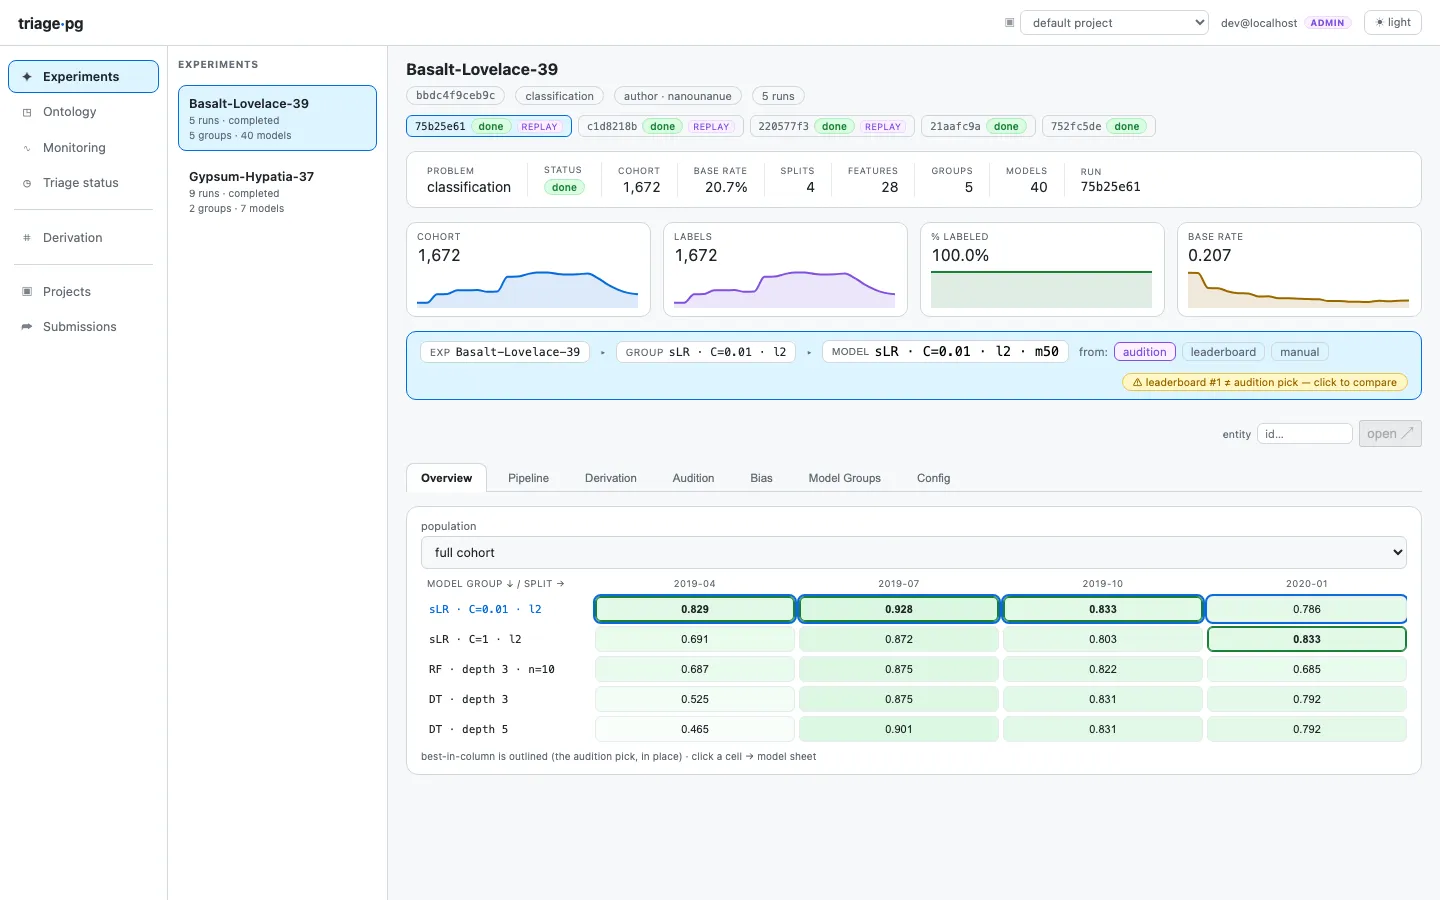
Five things worth 60 seconds each:
- The experiment header — the
classificationpill and the per-split cohort / %-labeled / base-rate sparklines. The hash chip is the sameb9e38fd8…the CLI printed. - The heatmap (Overview tab) — model groups × splits; the outlined cell is the best model per split; click one to open its model card.
- A model card — threshold curves (precision/recall as you sweep the list size k), score histogram, feature importances.
- The Derivation tab — the content-addressed artifact DAG the run built; re-run the same command and watch everything cache-hit.
- The Audition tab — DSSG’s model-selection rules (distance from best, regret) computed in PostgreSQL.
Where next
Section titled “Where next”- The full DirtyDuck case study — same
data, the whole discussion: early warning vs resource prioritization,
leakage, fairness, model selection, and the baseline floor (a
DummyClassifierin the grid) that turns “0.58 AUC” into “0.58 vs the 0.50 floor — the ML earns its keep”). - The Baselines reference — a metric
floor for every
problem_type(Dummy, time-series, marginal survival) and how to read the floor-vs-model gap. - The onboarding one-pager for the system-at-a-glance view.
just tutorial-downstops the database;just tutorial-cleanremoves it entirely (containers, images, volumes).