Technical architecture
Everything below is decided in the repo’s 28 committed
architecture decision records
and audited against the code in
docs/adr-conformance.md;
this page is the guided tour.
Two tiers: a registry and one database per project
Section titled “Two tiers: a registry and one database per project”A triage-pg deployment is a small registry control-plane database
(projects, users, submissions, per-project routing) plus one isolated
PostgreSQL database per Project, each holding a triage schema.
Teardown is DROP DATABASE; cross-project SQL is deliberately not native.
The dashboard’s project switcher routes each request to the right project
pool via the registry; single-project use needs no registry at all — the
write surface simply reports itself read-only.
Plain PostgreSQL is a hard constraint: no proprietary extensions, so the same schema, PL/pgSQL functions, and views run identically on a laptop, in Docker, self-hosted, or on RDS.
The results schema
Section titled “The results schema”Only decisions and outcomes live in the database — predictions (append-only, time-partitioned), evaluations, fairness metrics, lineage. Matrices are Parquet on the filesystem or S3; models are binaries beside them. The backbone:

Three edges carry the design:
artifacts+artifact_inputs— every built thing (cohort, labels, feature group, matrix, model) is a content-addressed node whose id hashes its complete input closure: config, parent artifacts, pinned source versions, engine versions. Caching, provenance, and garbage collection are all the same mechanism — a re-run cache-hits any node whose closure is unchanged, andtriage gcdeletes exactly what no root reaches.predictions(RESTRICT, append-only) — a score is never the score; it’s a row with ascored_attimestamp. Monitoring falls out of this for free: drift, volume, and realized-outcome views are just SQL over the accumulating history.experiments→runs— an experiment is the prediction problem (cohort + label + temporal config): features, grids, and imputation belong to the run, so adding features is a new attempt, not a new problem, and leaderboards stay comparable across attempts.
The full diagram with every FK and its ON DELETE behavior is in
docs/erd.md;
the design rationale in
docs/schema-design.md.
The pipeline
Section titled “The pipeline”
One pass of triage run (the CLI is the complete product; no UI
holds business logic):
- Experiment + run rows, then source pinning — every declared source is version-pinned at plan time so cacheability is decidable;
- temporal splits (timechop) fan into one cohort + one labels build over the union of dates;
- features — featurizer’s PostgreSQL-native Deep Feature Synthesis over the config’s entity graph, point-in-time-correct via as-of joins ;
- matrices per split (Parquet; fit-based imputation fitted on the train split only — the leakage boundary);
- train × grid, then append predictions and evaluate in-database (precision@k, AUC, regression metrics, survival C-index — PL/pgSQL, matching their scikit references to 1e-9).
Every stage is an artifact node, so interrupting and re-running resumes rather than redoing.
How it runs on AWS
Section titled “How it runs on AWS”The local/cloud split is a seam of three adapters — auth, storage,
execution — not a fork of the pipeline:
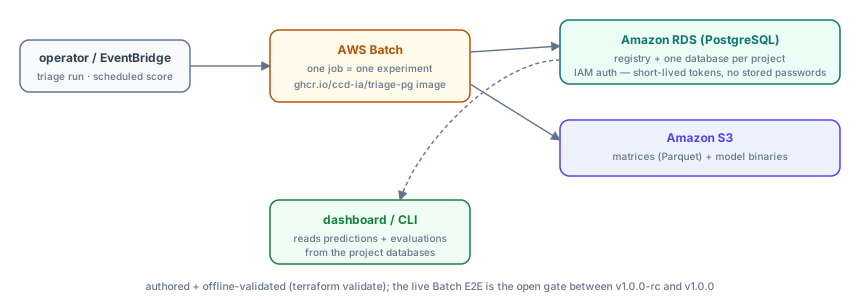
- auth: RDS IAM — per-project database roles issue short-lived tokens; no stored database passwords anywhere;
- storage: matrices and model binaries on S3, addressed by the same artifact hashes;
- execution: one AWS Batch job per experiment, running the same
ghcr.io/ccd-ia/triage-pgimage you can pull today; grid parallelism stays in-process. Scheduled scoring is an EventBridge rule invokingtriage score.
The Terraform for all of it lives in
infra/terraform/
with the operator’s walkthrough in
docs/cloud-runbook.md.
Honesty note: the cloud profile has been validated live, not just on paper —
one AWS Batch job ran an experiment end to end against RDS (20 models, 268,860
predictions, 120 evaluations; matrices and models on S3, predictions and
evaluations in the project database), which is what gated the v1.0.0 release.
The footprint was torn down afterwards, so running it again means a
terraform apply first.
Where next
Section titled “Where next”- The dashboard tour — every surface these tables feed, with screenshots.
- The CLI tour — the same surfaces, headless.
- The tutorials to see the whole thing run.