Chicago 311 — early warning, production-shaped
DirtyDuck taught the problem-framing lesson. This tutorial takes the other regime — a true early warning system, where the outcome is observed for every cohort member — and carries it through the surfaces you’d need to run such a model for real: fairness auditing, subset evaluations, monitoring over time, and a survival reformulation. None of these existed in DSSG’s tutorial; all of them are one config block or one CLI command here.
Prerequisites: the smoke test passes, and ideally you’ve read DirtyDuck.
The case
Section titled “The case”Chicago’s 311 line takes service requests — potholes, graffiti, broken street lights, sanitation complaints. Some are resolved same-day; some sit for months. A request that will resolve slowly is worth knowing about at filing time: it can be escalated, rerouted, or at minimum honestly communicated (“requests like yours currently take ~5 weeks”).
The question: which requests, at the moment they’re filed, will take more than 14 days to resolve?
The data and the stack
Section titled “The data and the stack”just chi311-up # 30,654 real service requests from 2019, baked into the imageuv run triage --dbfile chicago311-database.yaml db upgradeSame three-layer shape as every triage-pg project: raw → clean →
ontology.entities (one row per request: sr_type, owner_department,
origin, ward, community_area, created_date — the facts known at
filing) and ontology.events. The realized resolution (closed_date,
status) lives in its own table, ontology.request_outcome: it is the future
being predicted, and keeping it off the entity table makes the leakage guard
structural — a select * from ontology.entities cannot reach the label
source. The entity here is the request itself, not a facility —
a deliberate contrast with DirtyDuck: cohorts don’t have to be “things with
history”; they can be events at their moment of creation.
Formulation — and why %labeled is 100 this time
Section titled “Formulation — and why %labeled is 100 this time”From example/chicago311/experiment.yaml:
the cohort at each monthly as_of_date is every request filed in the prior
month; the label is slow resolution:
select e.entity_id, (o.closed_date is null or o.closed_date >= e.created_date + {label_timespan})::int as outcomefrom ontology.entities as ejoin ontology.request_outcome as o using (entity_id)where e.created_date >= {as_of_date}::date - interval '1 month' and e.created_date < {as_of_date}::dateNote the join: the label query reaches the future explicitly, through
ontology.request_outcome — the only table where the future lives.
Whether a request was resolved is administrative fact — the city’s own
records close every ticket eventually, so closed_date (or its absence) is
knowable for the entire cohort once the window matures. Nobody has to be
“inspected” for the outcome to exist. That is the early-warning regime:
task_framing: early_warningand it is why the dashboard’s %-labeled card reads 100% here without any alarm — while DirtyDuck’s inspections config sits at ~54%. If you ever see an early-warning experiment below 100%, the card now warns you: something is wrong with the label query or the data, because this regime promises full observation. (This exact question — “how can an inspections-style project be 100% labeled?” — is what the framing tag was born from.)
Base rate: ≈ 21% of requests are slow. And one teaching honesty note: most
of the signal lives in sr_type — potholes are structurally slow (~73% slow,
median 37 days), graffiti is same-day. An honest model reaches AUC ≈ 0.87 with
zero leakage; resolution information is never a feature.
Features — request attributes + backlog pressure
Section titled “Features — request attributes + backlog pressure”Two feature families, both as-of correct:
- the request’s own attributes: one-hot
sr_type/owner_department/origin, numeric ward and time-of-filing; - backlog aggregations — the system’s state when you filed:
area_backlog(recent request volume in your community area) andtype_demand(recent demand for your service type), aggregated over trailing windows.
The second family is the interesting one: it makes the model operational — “your pothole will be slow because the system is drowning in potholes right now”, not just “potholes are slow”.
Run it
Section titled “Run it”The tutorial config with the full production surface — fairness + subsets + framing — is the base config plus three identity-neutral blocks (shown in the sections below):
uv run triage --dbfile chicago311-database.yaml run \ example/chicago311/experiment.yaml --project-path /tmp/chi311-runuv run triage --dbfile chicago311-database.yaml leaderboard <hash-prefix>just serve 8001 # cp chicago311-database.yaml database.yaml firstExpect 7 model groups × 4 splits = 28 models, ~81,000 predictions, and a leaderboard whose top AUCs sit in the high .80s–low .90s per split.
With AUCs that high, is the signal real or is the base rate just favorable? The
committed grid already ships two baselines next to the real estimators — the
constant-prior DummyClassifier and the DSSG-original BaselineRankMultiFeature,
which does nothing but rank requests by their neighbourhood’s prior request count
(“just escalate the busiest areas”):
grid_config: # ... your real estimators ... 'sklearn.dummy.DummyClassifier': strategy: ['prior'] 'triage.component.catwalk.baselines.rankers.BaselineRankMultiFeature': rules: [[{feature: 'COUNT(area_backlog.date)', low_value_high_score: false}]]On the leaderboard (per-algorithm averages across the 4 splits):
| model | AUC | precision@100 |
|---|---|---|
| DecisionTreeClassifier | 0.871 | 0.804 |
| ScaledLogisticRegression | 0.868 | 0.856 |
| RandomForestClassifier | 0.866 | 0.818 |
BaselineRankMultiFeature (heuristic) | 0.570 | 0.343 |
DummyClassifier (constant floor) | 0.500 | 0.253 |
Here the verdict is unambiguous: the real models (AUC ≈ 0.87) crush both the
neighbourhood-load heuristic (0.570) and the constant floor (0.500). Unlike
DirtyDuck — where “sort by the obvious feature” was competitive at the top of the
list — on Chicago 311 the backlog-pressure features genuinely earn their
complexity. Every problem_type has such a floor — the survival variant below has
marginal Kaplan–Meier / Nelson–Aalen floors at C-index ≈ 0.5. See the
Baselines reference for the full catalog.
Fairness — geography as the protected attribute
Section titled “Fairness — geography as the protected attribute”311 responsiveness has a long civil-rights history: response times that differ
by neighborhood are differences in whose problems get fixed. The honest
protected-attribute proxy in this data is geography —
community_area:
bias_config: query: | select entity_id, community_area from ontology.entities where created_date < '{as_of_date}' parameter: 300_abs tau: 0.8Identity-neutral: appending it and re-running cache-hits the whole pipeline and adds the audit — hundreds of thousands of protected-attribute rows and per-area fairness metrics over the top-300 list. In the dashboard’s Bias tab: eight per-group metrics with disparity ratios and τ-verdicts (a group whose disparity falls outside [τ, 1/τ] fails), and the fairness-tree wizard — DSSG’s Aequitas decision tree as an interactive guide. Two questions (“is the intervention punitive or assistive?”, “do you intervene on everyone flagged?”) highlight which metric family you should care about — here an escalation is assistive, so false-negative parity (who gets missed) matters more than who is wrongly escalated.
Subsets — evaluate where the policy applies
Section titled “Subsets — evaluate where the policy applies”City-wide metrics can hide neighborhood-level failure. A subset evaluation re-ranks and re-evaluates within a named slice:
evaluation: subsets: - name: austin query: | select entity_id from ontology.entities where community_area = 25 and created_date < '{as_of_date}'The dashboard’s evaluation panels gain a population selector (full cohort ↔ austin), and the CLI leaderboard accepts the same choice. The semantics matter: the subset is re-ranked within itself — precision@300 among Austin’s requests, as if Austin were your whole world — which is the question an area coordinator actually asks.
Monitoring — what happens after the backtest
Section titled “Monitoring — what happens after the backtest”Everything so far is backtesting (purpose: experiment — the provenance chip
on the monitoring view says so). Production means scoring forward on a
schedule and watching for rot. triage-pg’s monitoring is deliberately
daemon-free: a scheduled CLI entrypoint plus SQL views over the append-only
predictions history.
# score a date's cohort with a chosen model (normally a cron/EventBridge job;# the date defaults to today — with the 2019 tutorial data, use one in range)uv run triage --dbfile chicago311-database.yaml score <model-id> 2019-12-01Each invocation appends predictions stamped scored_at (the moment of
scoring) — never overwrites — so day after day the history accumulates and the
Monitoring view fills in:
- score drift: PSI and KS between the reference window and the latest scores (thresholds chipped green/amber/red);
- volume: predictions per scoring day — the heartbeat that tells you the cron is alive;
- realized outcomes: as labels mature, re-running evaluation upserts the realized metrics per as-of date — the “was the model still right?” curve.
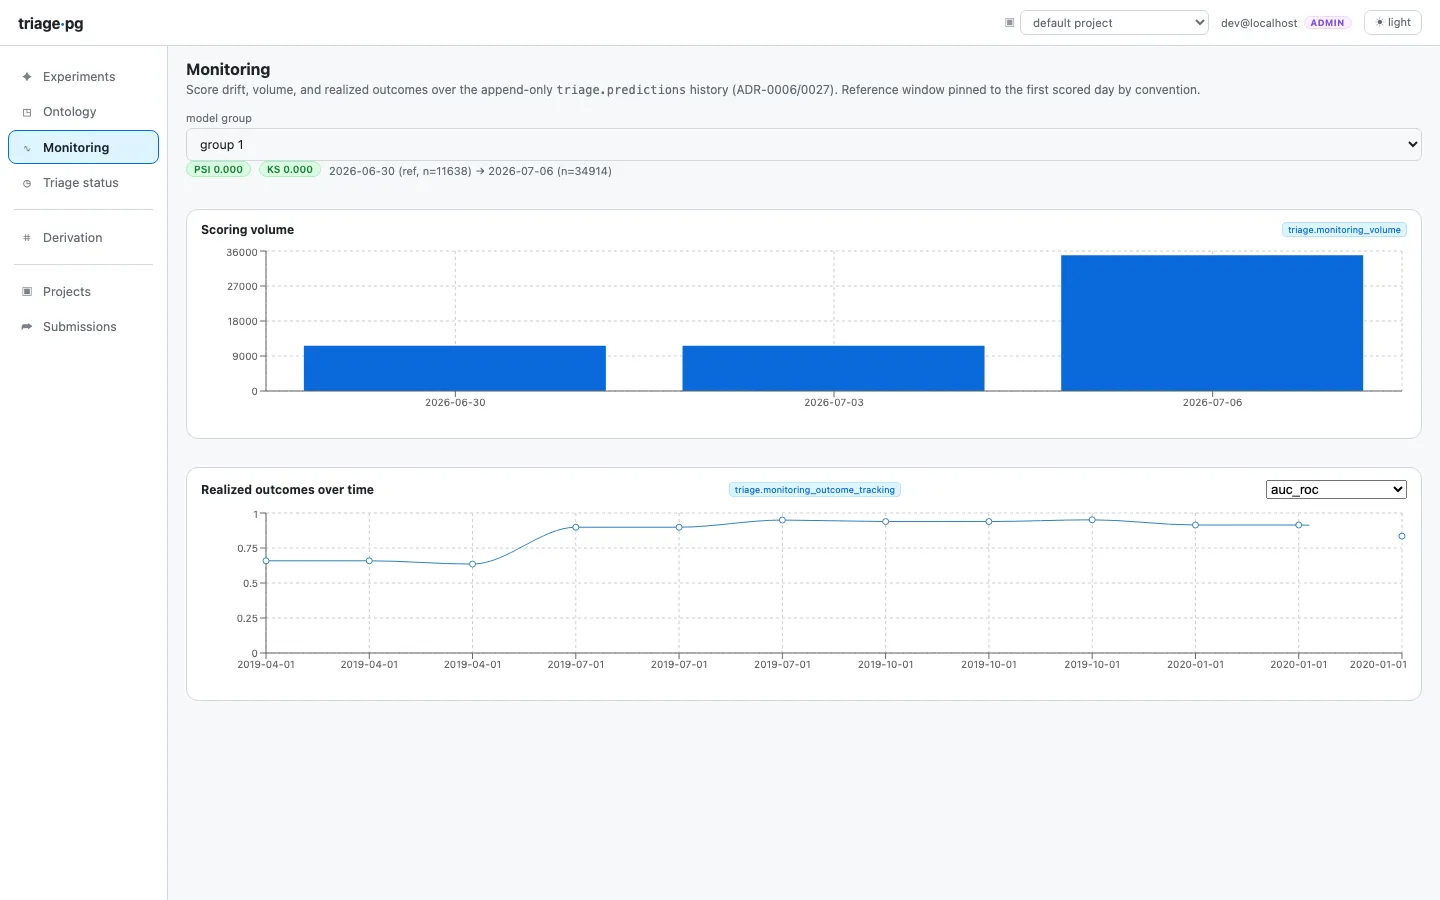
Append-only is the design decision that makes all of this cheap:
a score is never “the” score, it’s a row with a timestamp; “current” is just
max(scored_at).
Survival — same question, finer answer
Section titled “Survival — same question, finer answer”“Slow or not slow” throws away information: how slow? The survival variant
(example/chicago311/experiment-survival.yaml)
reformulates the label as time-to-resolution:
problem_type: survival# label produces: duration (days filing → closure), event_observed# (false = still open at the window's end — censored, not ignored)Censoring is the crux: a request still open when the window closes isn’t a
missing label, it’s a lower bound (“at least 60 days”). Survival estimators
(scikit-survival’s Cox model behind the survival extra) use censored rows
correctly, and evaluation switches to the concordance index — computed by
a PL/pgSQL function inside the database, matching scikit-survival’s reference
to 1e-9. In the dashboard, the survival experiment’s header shows the
survival pill, duration/censored rows in the entity drawer, and an event
rate card where classification shows a base rate.
uv run triage --dbfile chicago311-database.yaml run \ example/chicago311/experiment-survival.yaml --project-path /tmp/chi311-runWhere this differs from DSSG triage
Section titled “Where this differs from DSSG triage”Fairness here is SQL over a long-format protected_groups table (Aequitas’
metrics, none of its runtime); subsets re-rank in the database; monitoring is
CLI + SQL views instead of an external scheduler product; survival is a
first-class problem_type rather than out of scope. The
side-by-side
has the full account.
Where next
Section titled “Where next”- DonorsChoose — diffuse signal and the deep feature synthesis showcase.
docs/fairness.md·docs/monitoring.md·docs/problem-types.mdjust chi311-downwhen done.