The dashboard, surface by surface
The dashboard is a deliberately thin window: every number you’ll see is a
SELECT over the views and functions in the triage schema (no
business logic in the UI), so anything shown here is equally scriptable from
the CLI or psql. Start it with just serve
against any project database.
Experiments — the front page
Section titled “Experiments — the front page”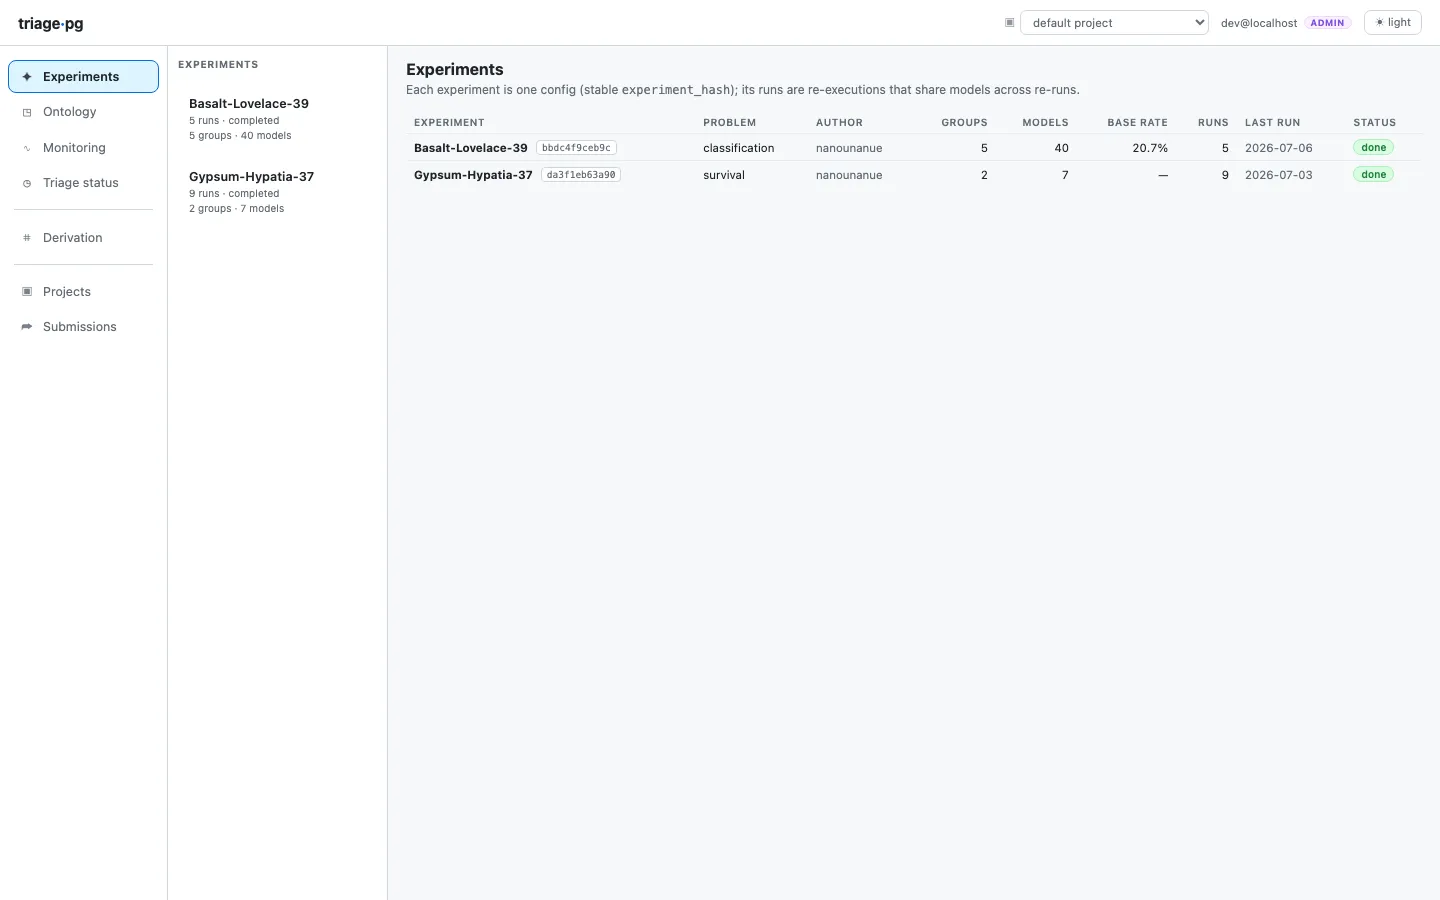
One row per experiment (= prediction problem): problem type,
observation-regime pill (early warning / resource prioritization /
visit level), model/group counts, base rate, last run status. The question
it answers: what problems does this project attack, and are they healthy?
The experiment overview
Section titled “The experiment overview”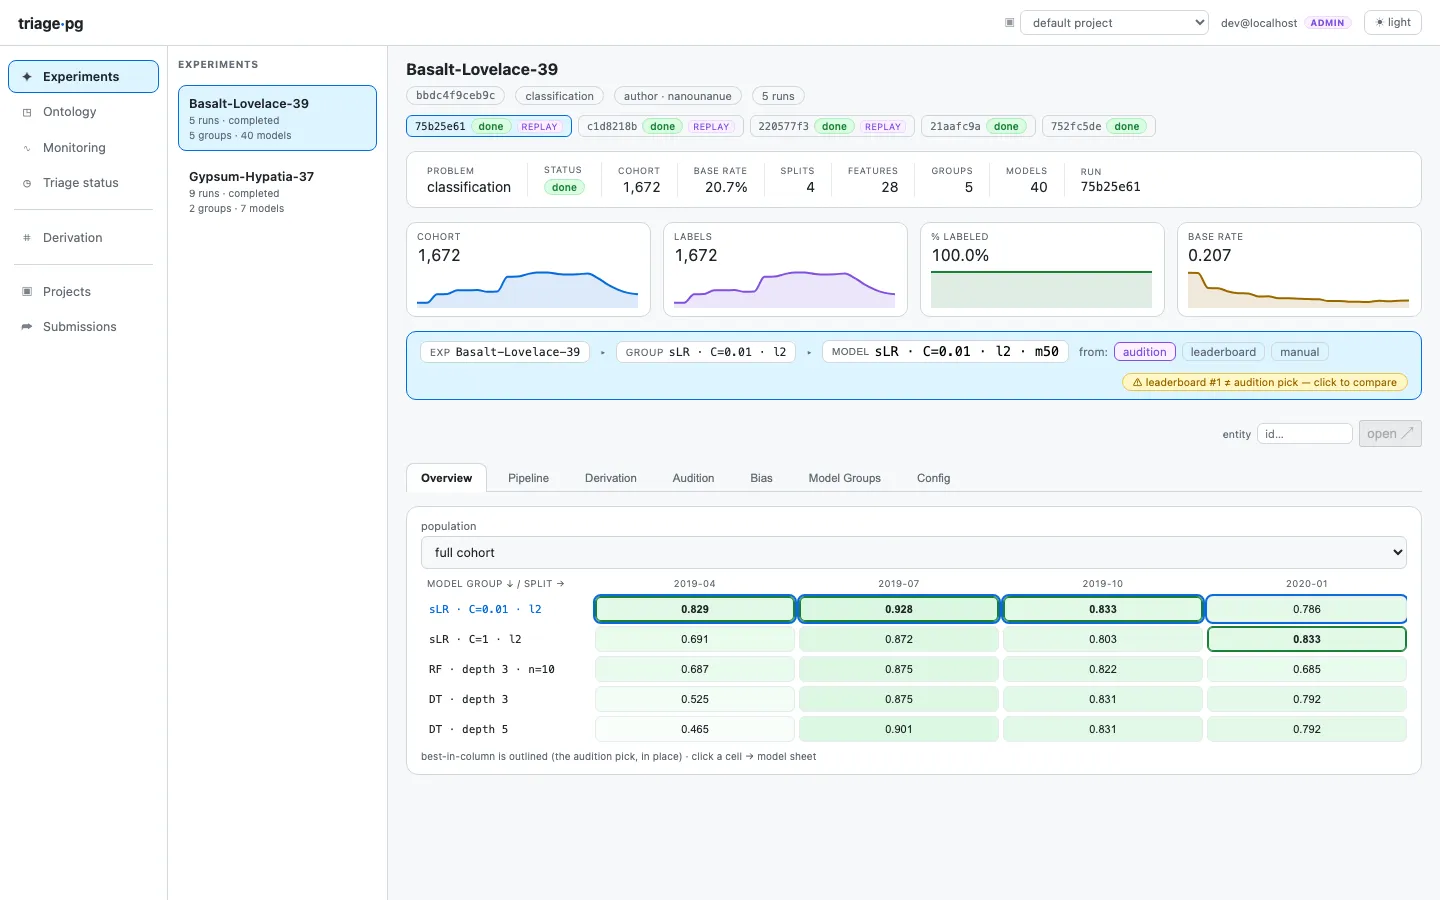
The working view. The header carries the identity chips (hash, problem type, framing) and the four per-split sparklines — cohort size, labels, %-labeled (framing-aware: an inspections problem expects <100%), base rate. Below, the heatmap: model groups × temporal splits, best-in-split outlined — the “which model family is winning, and is it stable over time?” panel. A population selector re-scopes everything to a named subset when subset evaluations exist.
The model card
Section titled “The model card”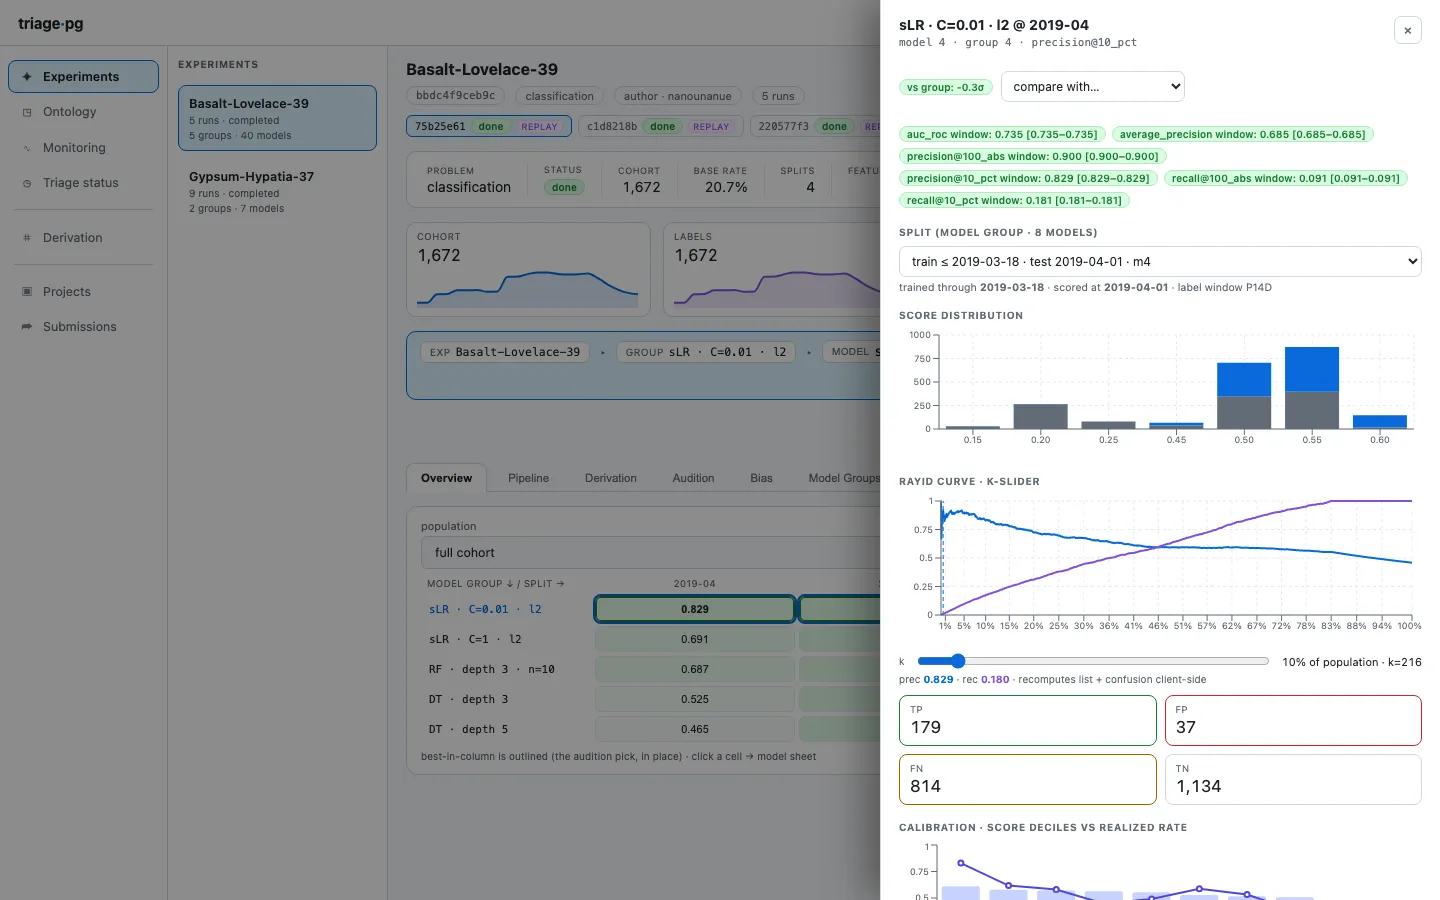
One model’s dossier. The threshold curve is the operational panel —
precision/recall as you sweep the list size k, i.e. “if we can act on the top
k, what do we get?”. Score histogram, calibration deciles, persisted feature
importances, and the postmodeling panels (crosstabs, error tree) when
triage postmodel has run.
Audition — model selection with discipline
Section titled “Audition — model selection with discipline”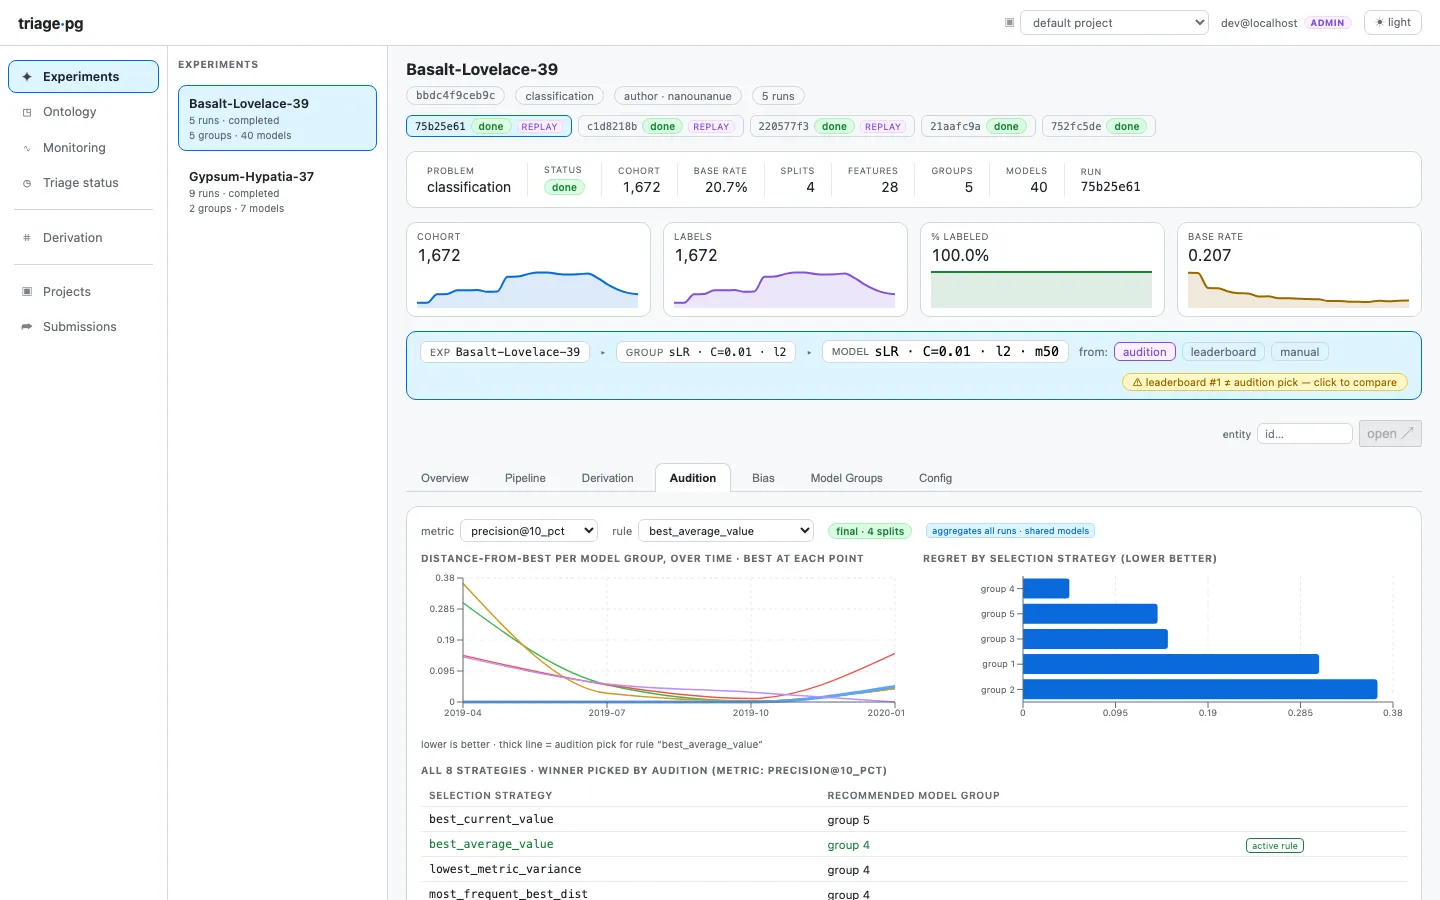
DSSG’s selection rules (distance-from-best, max regret, regret-next-time…) computed as SQL views. The question: which model group would we actually deploy — the one that’s never far from best across time, not the lucky winner of one split. When the leaderboard’s #1 and audition’s pick disagree, the context bar flags it.
Bias — fairness with a guide
Section titled “Bias — fairness with a guide”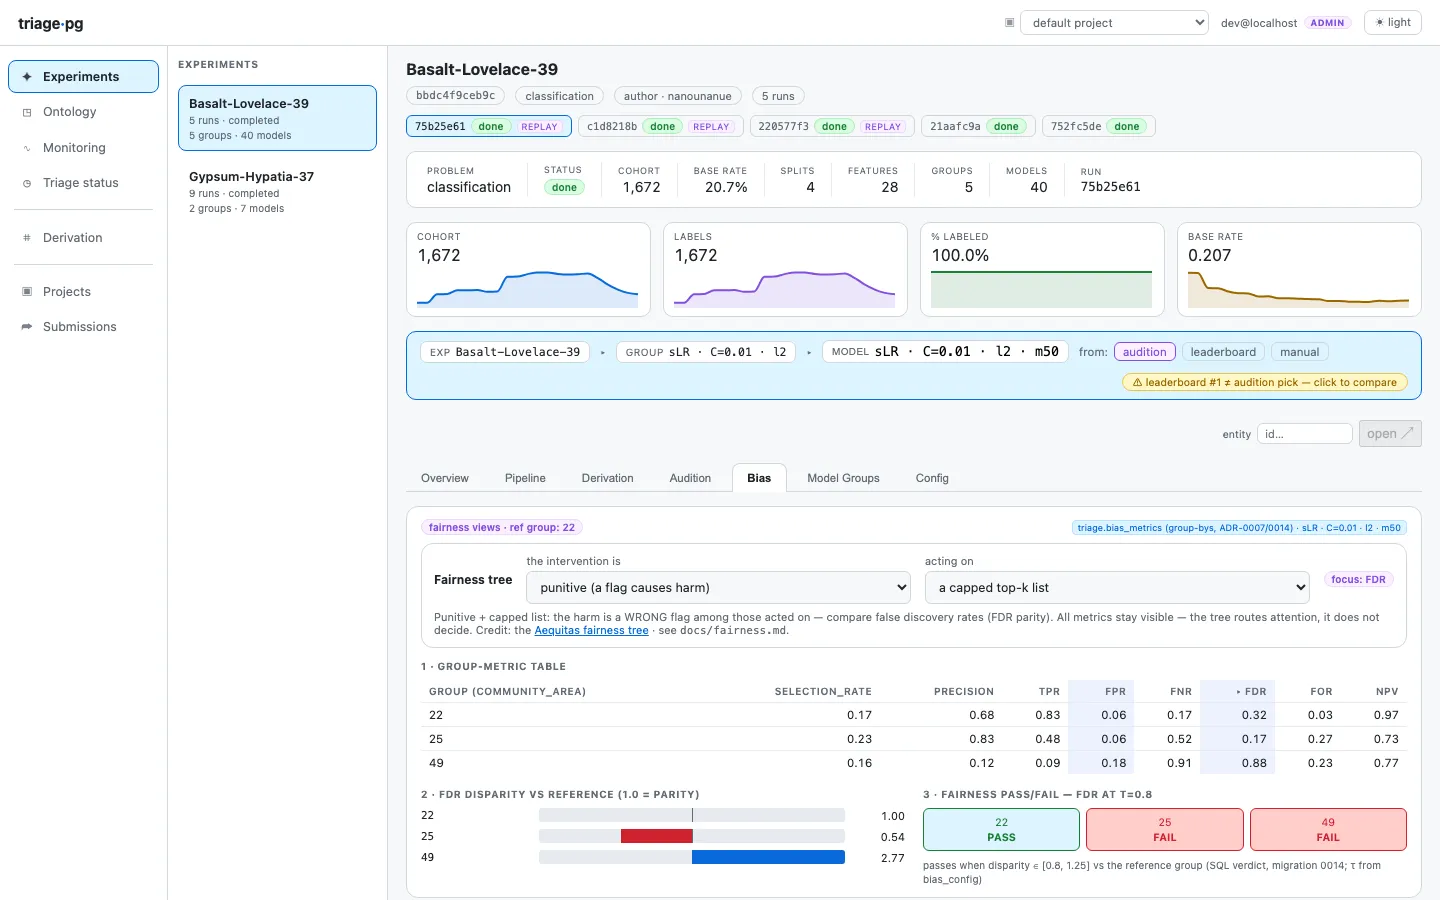
Per-protected-group metrics over the top-k list with disparity ratios and
τ-verdicts, straight from the SQL bias_metrics table (Aequitas’ math, no
Python runtime). The fairness-tree wizard asks the two Aequitas questions
(punitive or assistive? intervene on all flagged?) and highlights the metric
family your intervention actually implicates.
Model groups
Section titled “Model groups”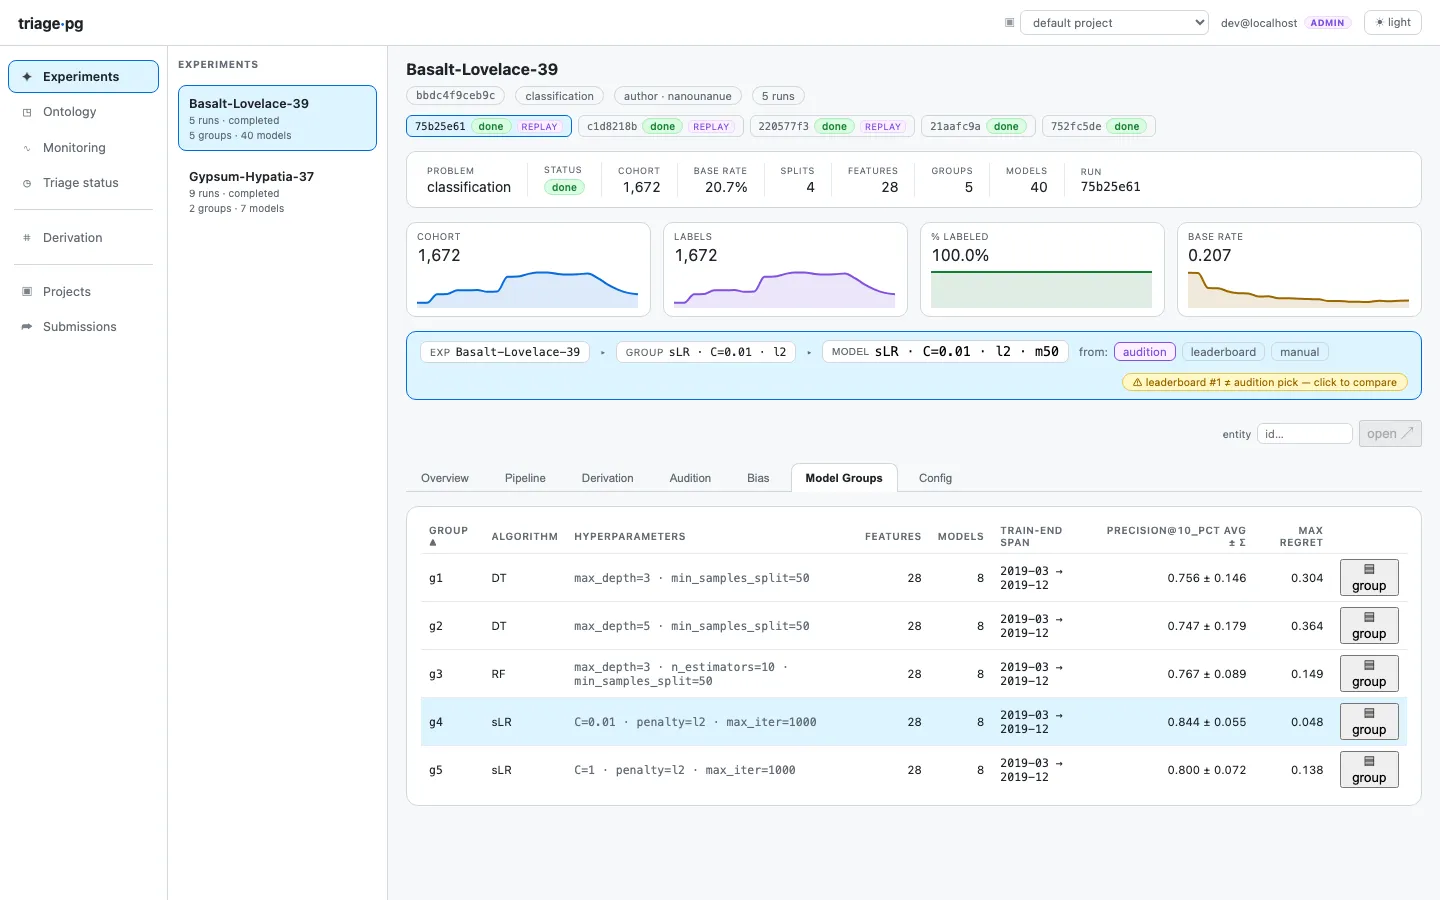
The hyperparameter-family rollup (avg ± σ, max regret, fit time) — and where feature-group ablation runs become comparable side by side.
Monitoring
Section titled “Monitoring”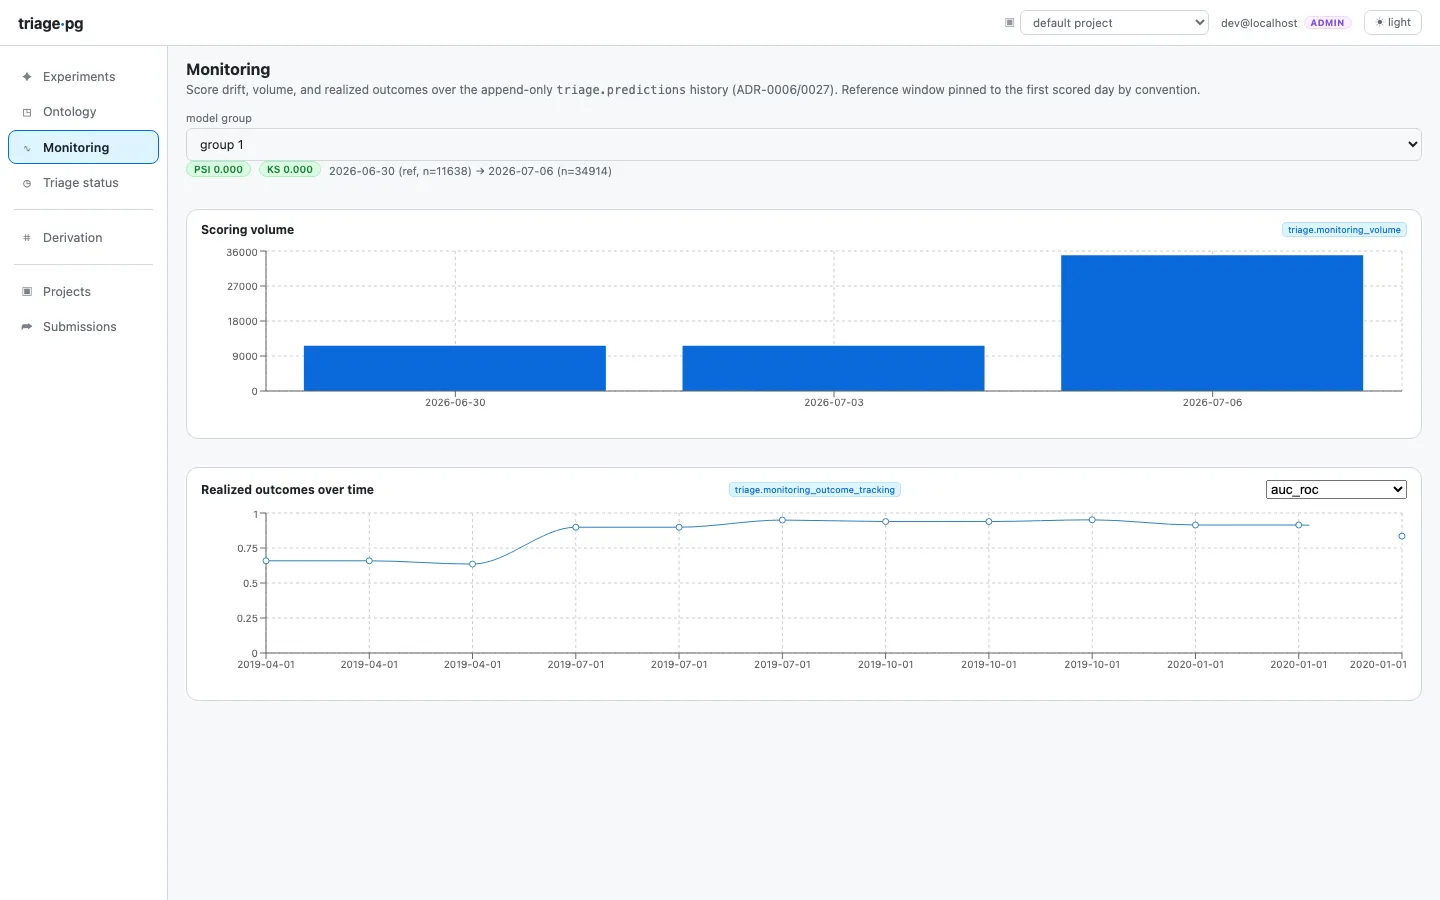
The post-deployment view over the append-only predictions history: score
drift (PSI/KS chips), the scoring-volume heartbeat, and realized outcomes as
labels mature. The purpose chip is the provenance honesty marker —
experiment rows are backtest history, forward_score rows are production.
Projects & Submissions — the write surface
Section titled “Projects & Submissions — the write surface”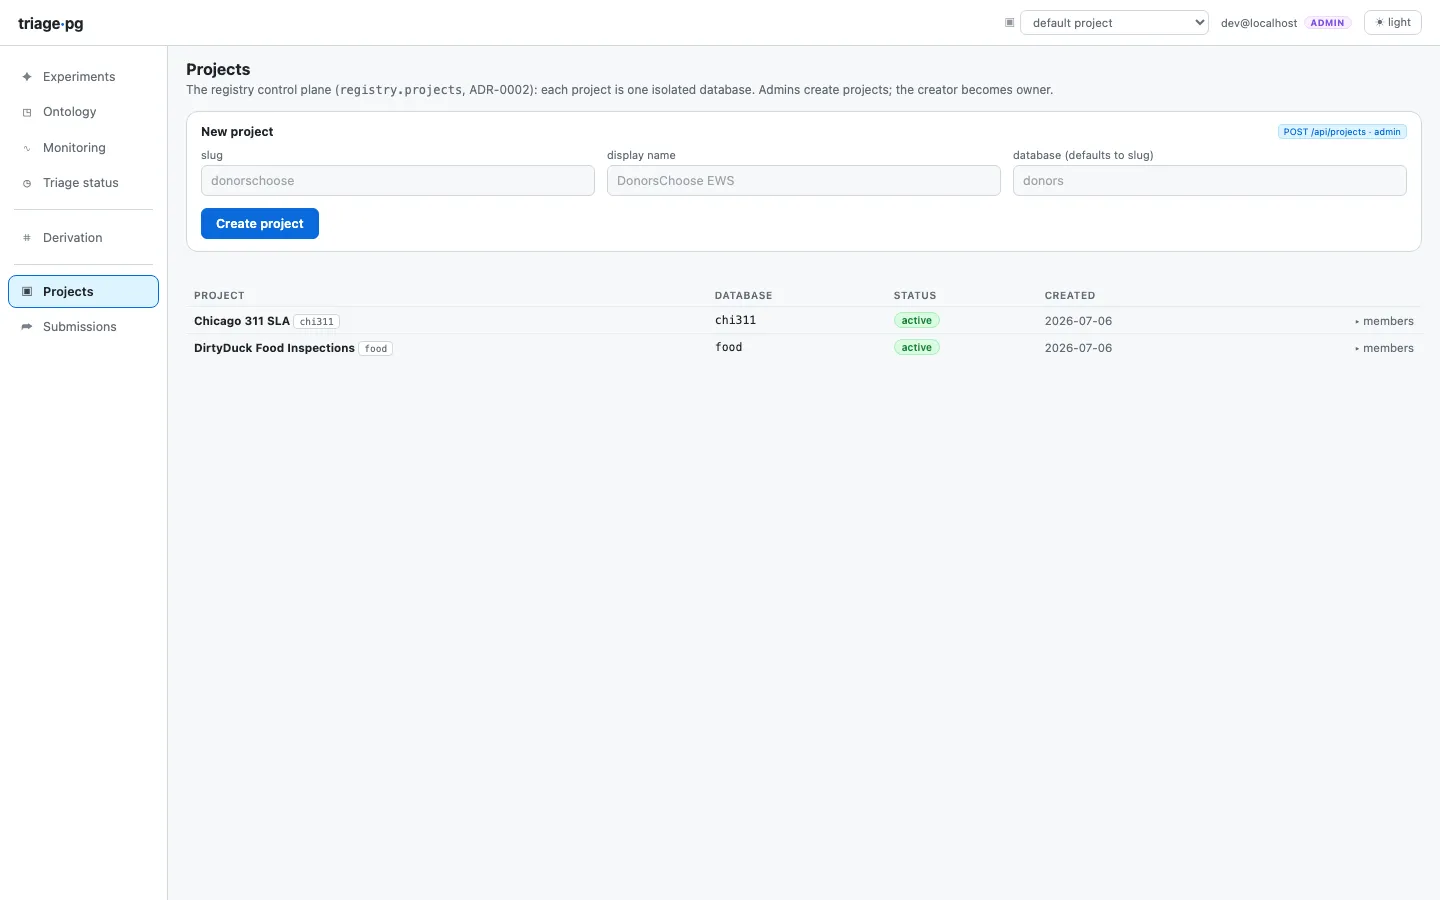
With a registry configured (TRIAGE_REGISTRY_URL), Projects manages the
one-database-per-project lifecycle and Submissions accepts experiment
configs through the same validator the CLI uses — dry-run verdicts with
path-addressed errors before anything runs:
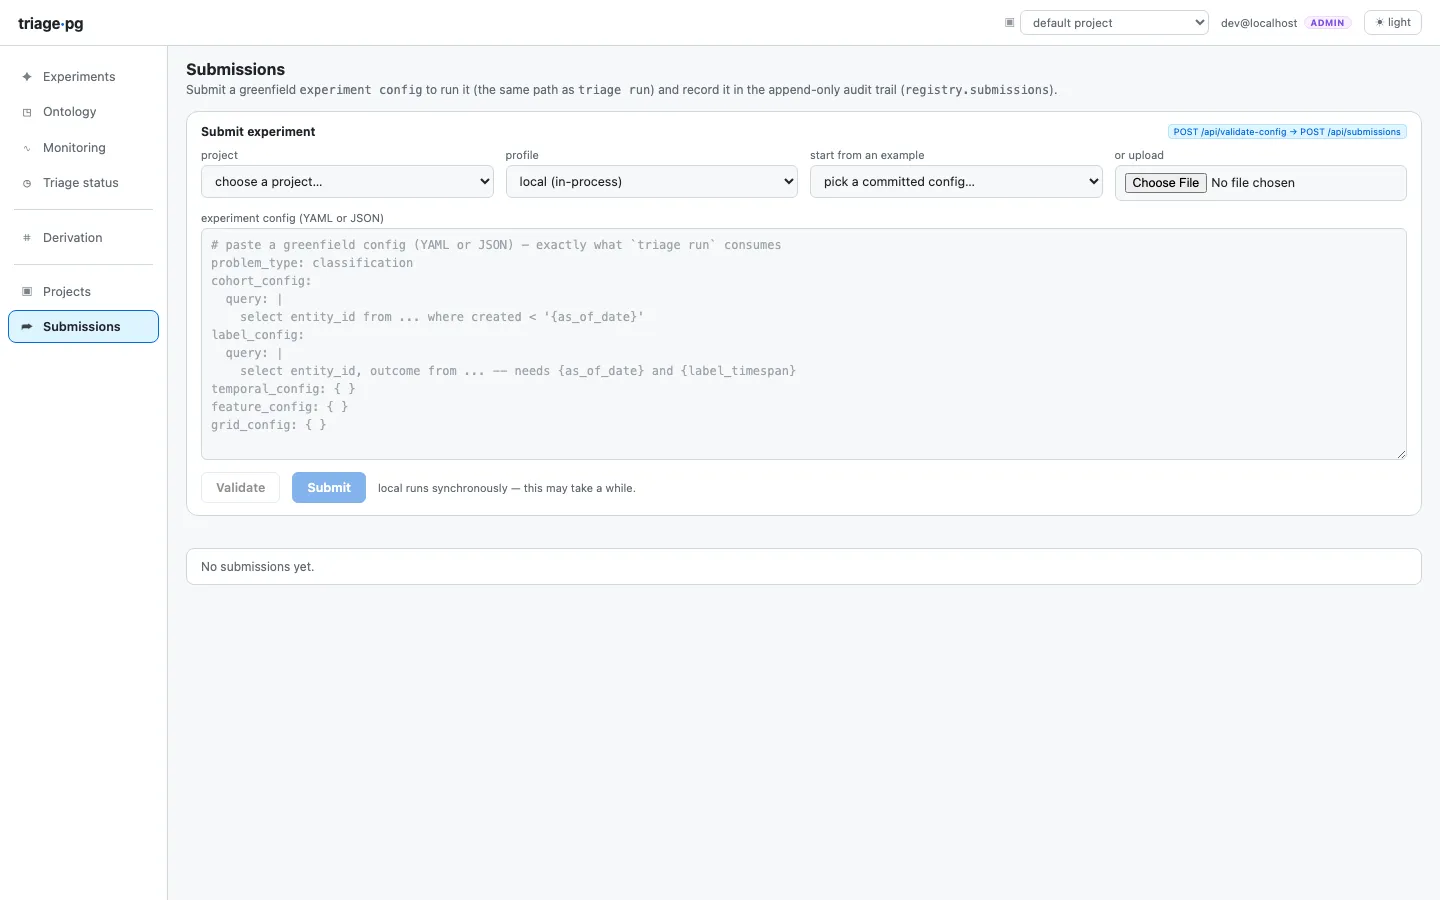
Without a registry, both render a neutral read-only notice — a supported deployment, not an error.
Where next
Section titled “Where next”- The entity drawer and derivation graph appear in the tutorials’ guided tours.
- Architecture explains the tables all of this reads.